


Recently, a client asked me to create an Excel model that they could fully understand and modify if needed. That comment changed my thought process on how to solve it.
Read more: Create a solution we can understandAudit friendly model
There are different types of Excel models. In some cases, the logic is very complex and there’s no easy way to solve it. It may not be possible to explain everything to end users who have basic skills. End users use the model and never understand how the formulas / code works.
However, sometimes a client has strong Excel knowledge and requests a model that can be understood and modified in places. It may be possible to accommodate this request if the model is built carefully.
What does strong Excel mean?
There are endless ways to assess Excel knowledge. I like the hierarchy from Financial Modeling World Cup.
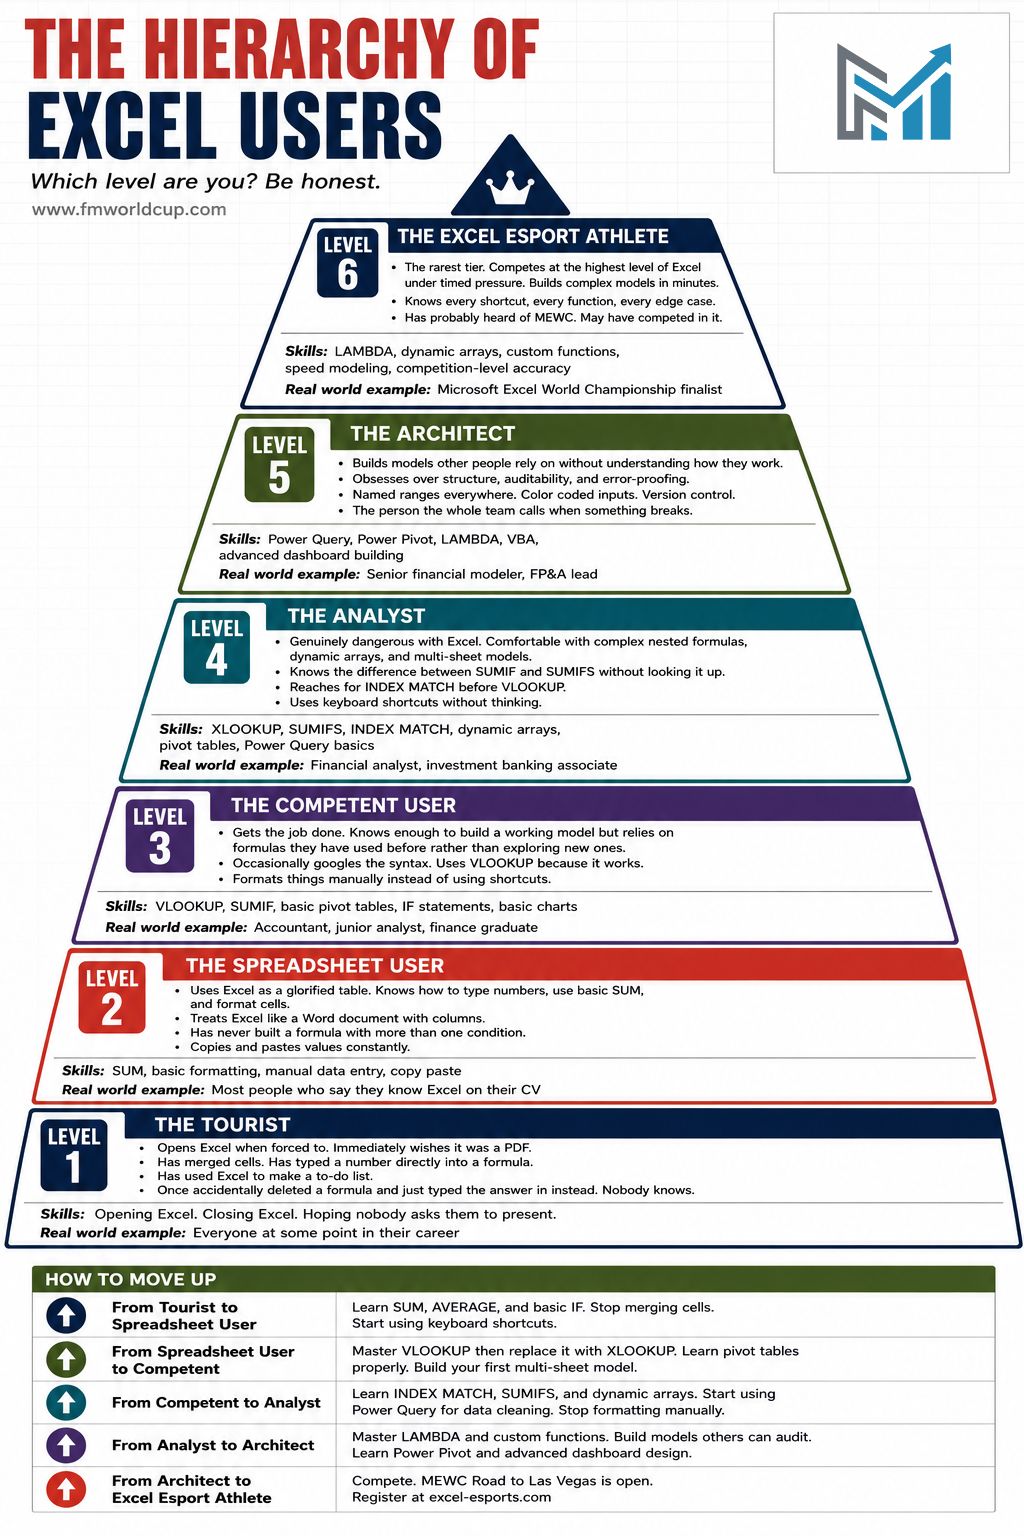
My client’s Excel skills are mostly level 3. I believe my Excel skills are mostly level 5. More on this hierarchy later.
How did I build the model?
I broke down the logic into smaller components. This may not always be possible but it was in this case.
I limited my use of dynamic array functions: one UNIQUE and one FILTER. Why? Dynamic array functions can perform magic but most are too complex for the average user especially when several are nested in the same formula. Here’s a list of dynamic array functions from www.ablebits.com
- UNIQUE extracts unique items from a range of cells.
- FILTER filters data based in the criteria you define.
- SORT sorts a range of cells by a specified column.
- SORTBY sorts a range of cells by another range or array.
- RANDARRAY generates an array of random numbers.
- SEQUENCE generates a list of sequential numbers.
- TEXTSPLIT splits strings by a specified delimiter across columns or/and rows.
- TOCOL converts an array or range to a single column.
- TOROW transform a range or array into a single row.
- WRAPCOLS converts a row or column into a 2D array based on the specified number of values per row.
- WRAPROWS re-shapes a row or column into a 2D array based on the specified number of values per column.
- TAKE extracts a specified number of contiguous rows or columns from the start or end of an array.
- DROP removes a certain number of rows or columns from an array.
- EXPAND grows an array to the specified number of rows and columns.
- CHOOSECOLS returns the specified columns from an array.
- CHOOSEROWS extracts the specified rows from an array.
- GROUPBY groups and aggregate data in rows based on the values in one or more columns.
- PIVOTBY groups data in rows and columns and aggregate the values.
- BYROW applies a specified function to each row in a range and returns one result per row.
- BYCOL performs a specified calculation on each column in a given range.
- TRIMRANGE removes blank columns and/or rows a range’s outer edges.
- MAP performs a custom calculation on each value in an array.
- SCAN processes an array of values sequentially and returns every intermediate result.
- REDUCE iterates through an array and returns one final aggregated value.
I can’t share the solution I created for my client but I found an Excel BI challenge that I’ll use to demonstrate the idea.
Excel BI challenge
Excel BI has dozens of fun Excel challenges! Visit their ExcelBI website! This challenge asks us to rearrange column A data into rows and columns as seen below in columns C to H:
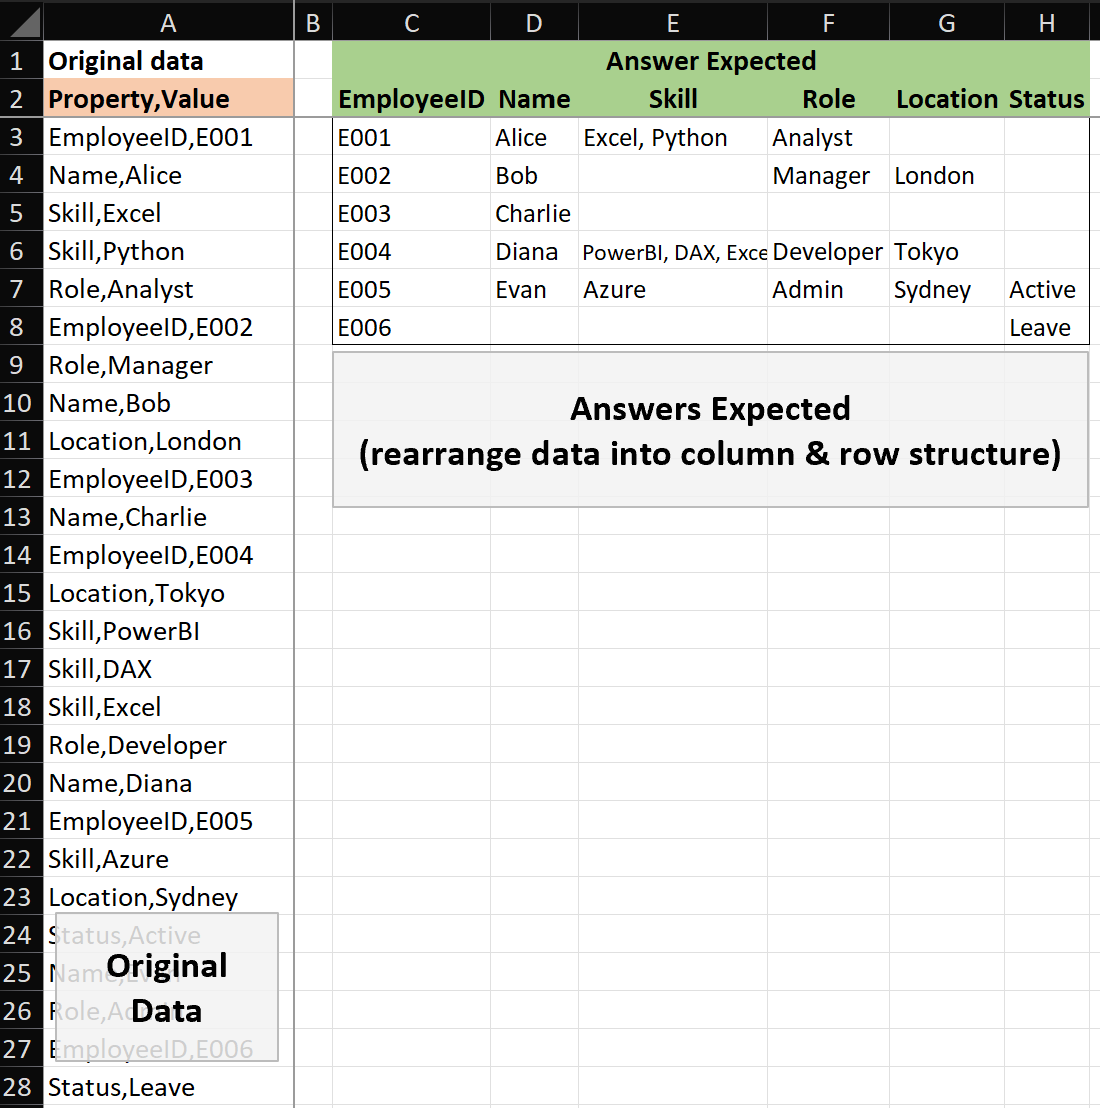
Examine the data!
It’s ESSENTIAL to carefully examine the data and the requirements.
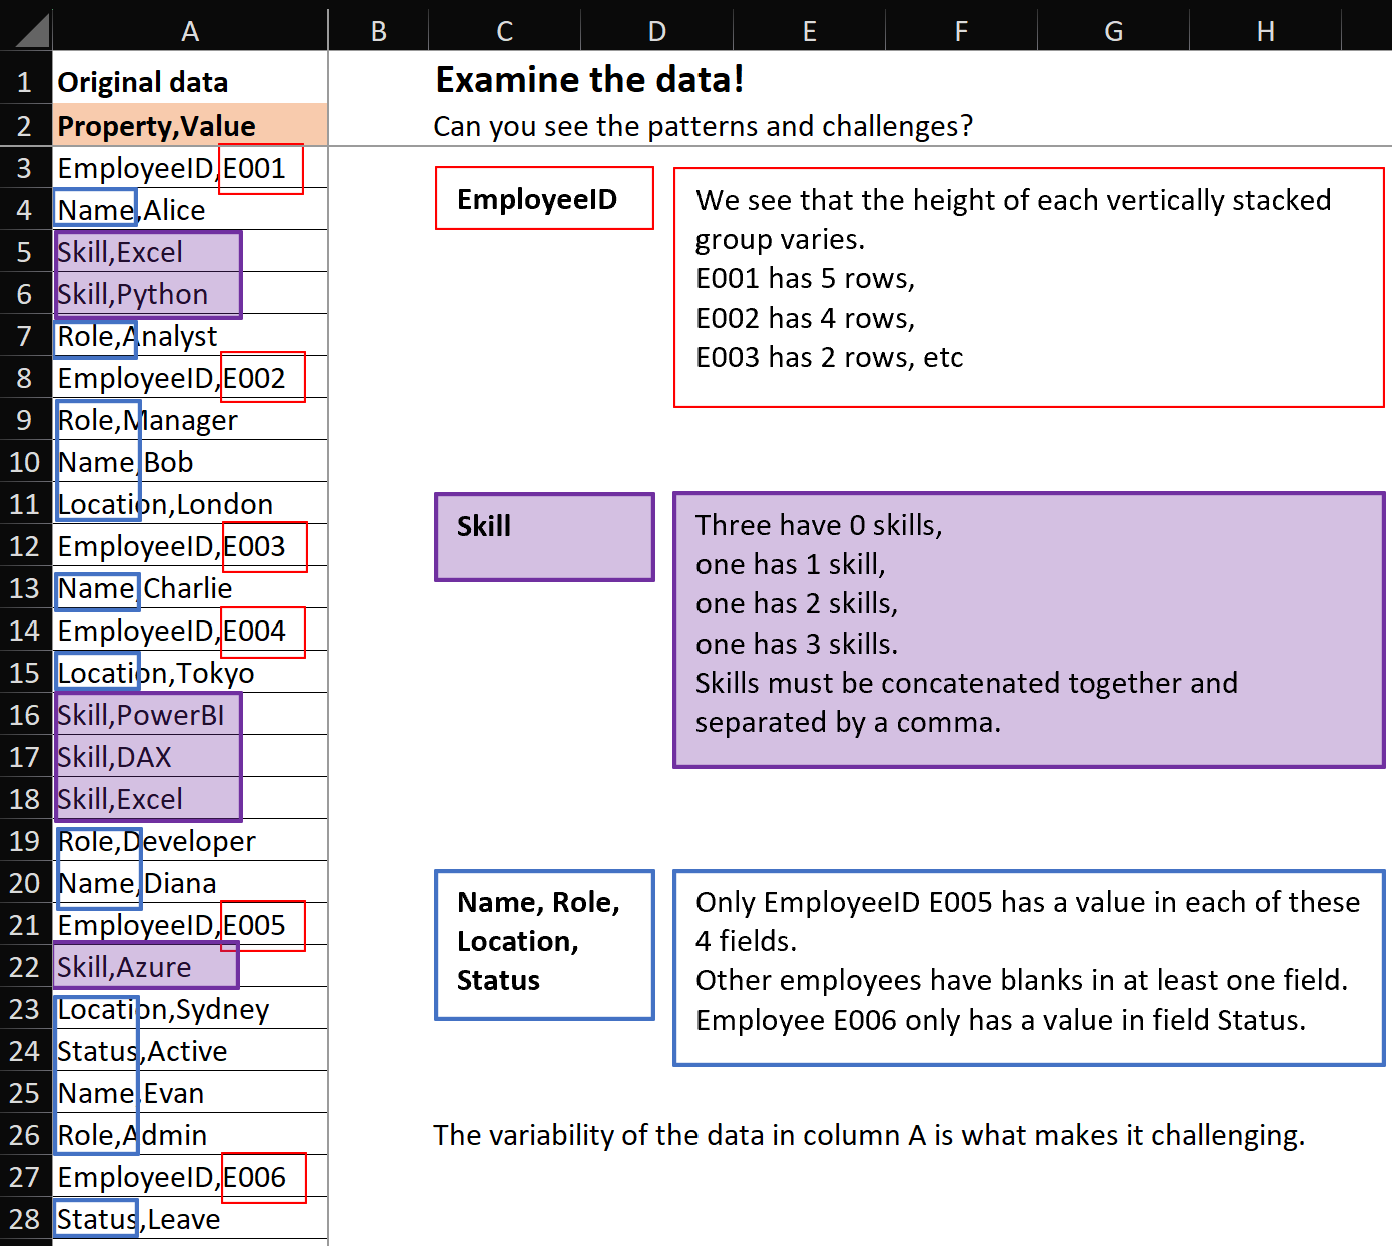
The challenge: each EmployeeID group is different as explained in the picture above. To start, we can separate the groups using the EmployeeID code highlighted in red.
Complex single cell formulas
Solutions using single cell formulas with multiple dynamic array functions. Each formula comes from a comment posted on Excel BI’s LinkedIn challenge post.
If you understand these formulas then you are a level 5 or 6 Excel user! If you can read them, like you read a sentence in the newspaper, then you might be Diarmuid Early!
=LET(i,A3:A28,j,GROUPBY(SCAN(,REGEXEXTRACT(i,"E\d+|$"),LAMBDA(x,y,IF(y="",x,y))),i&";",CONCAT,,0),HSTACK(TAKE(j,,1),REGEXREPLACE(TAKE(j,,-1),"((?<="&{"Name","Skill","Role","Location","Status"}&",)([^;]+))(?=.*((?1)))?|.","$2${3:+, }")))=LET(s,A3:A28,k,TEXTBEFORE(s,","),v,TEXTAFTER(s,","),g,SCAN(0,k,LAMBDA(a,b,a+(b="EmployeeID"))),u,UNIQUE(FILTER(g,g>0)),uu,TOROW(UNIQUE(k)),DROP(REDUCE("",u,LAMBDA(x,id,VSTACK(x,MAP(uu,LAMBDA(h,LET(z,FILTER(v,(g=id)*(k=h),""),IF(h="Skill",TEXTJOIN(", ",,z),IFERROR(TAKE(z,-1),"")))))))),1))=LET(a,A3:A28,b,TEXTSPLIT(a,","),c,TEXTAFTER(a,","),d,XMATCH(b,b),e,SCAN(0,d=1,SUM),DROP(PIVOTBY(e,HSTACK(d,b),c,ARRAYTOTEXT,,0,,0,,,3),1,1))=LET(i,DROP(TEXTSPLIT(CONCAT("/"&A3:A28),{",","ID"},"/",,,""),1),g,SCAN(0,TAKE(i,,-1),LAMBDA(a,b,IF(b="",a,b))),u,TAKE(i,,1),e,DROP(PIVOTBY(g,HSTACK(MATCH(u,u,0),u),CHOOSECOLS(i,2),ARRAYTOTEXT,,0,,0),1),HSTACK(VSTACK("EmployeeID",DROP(TAKE(e,,1),1)),DROP(e,,2)))=LET(z,A3:A28,f,LAMBDA(x,x(z,",")),a,f(TEXTBEFORE),b,UNIQUE(a),DROP(PIVOTBY(SCAN(,IFERROR(SEARCH("id",z),0),SUM),HSTACK(XLOOKUP(a,b,SEQUENCE(ROWS(b))),a),f(TEXTAFTER),ARRAYTOTEXT,,0,,0),1,1))=LET(d,A3:A28,p,TEXTSPLIT(d,","),DROP(PIVOTBY(SCAN(0,d<"F",SUM),HSTACK(XMATCH(p,p),p),TEXTAFTER(d,","),ARRAYTOTEXT,,0,,0),1,1))Splitting the logic into smaller bits
Excel BI’s challenge can be solved by splitting the logic into smaller pieces. To keep it simple, I also did this:
- I only used 2 dynamic array functions: UNIQUE and FILTER
- No mega formulas: each formula uses 3 functions or less
- Steps are clearly labelled starting in column K
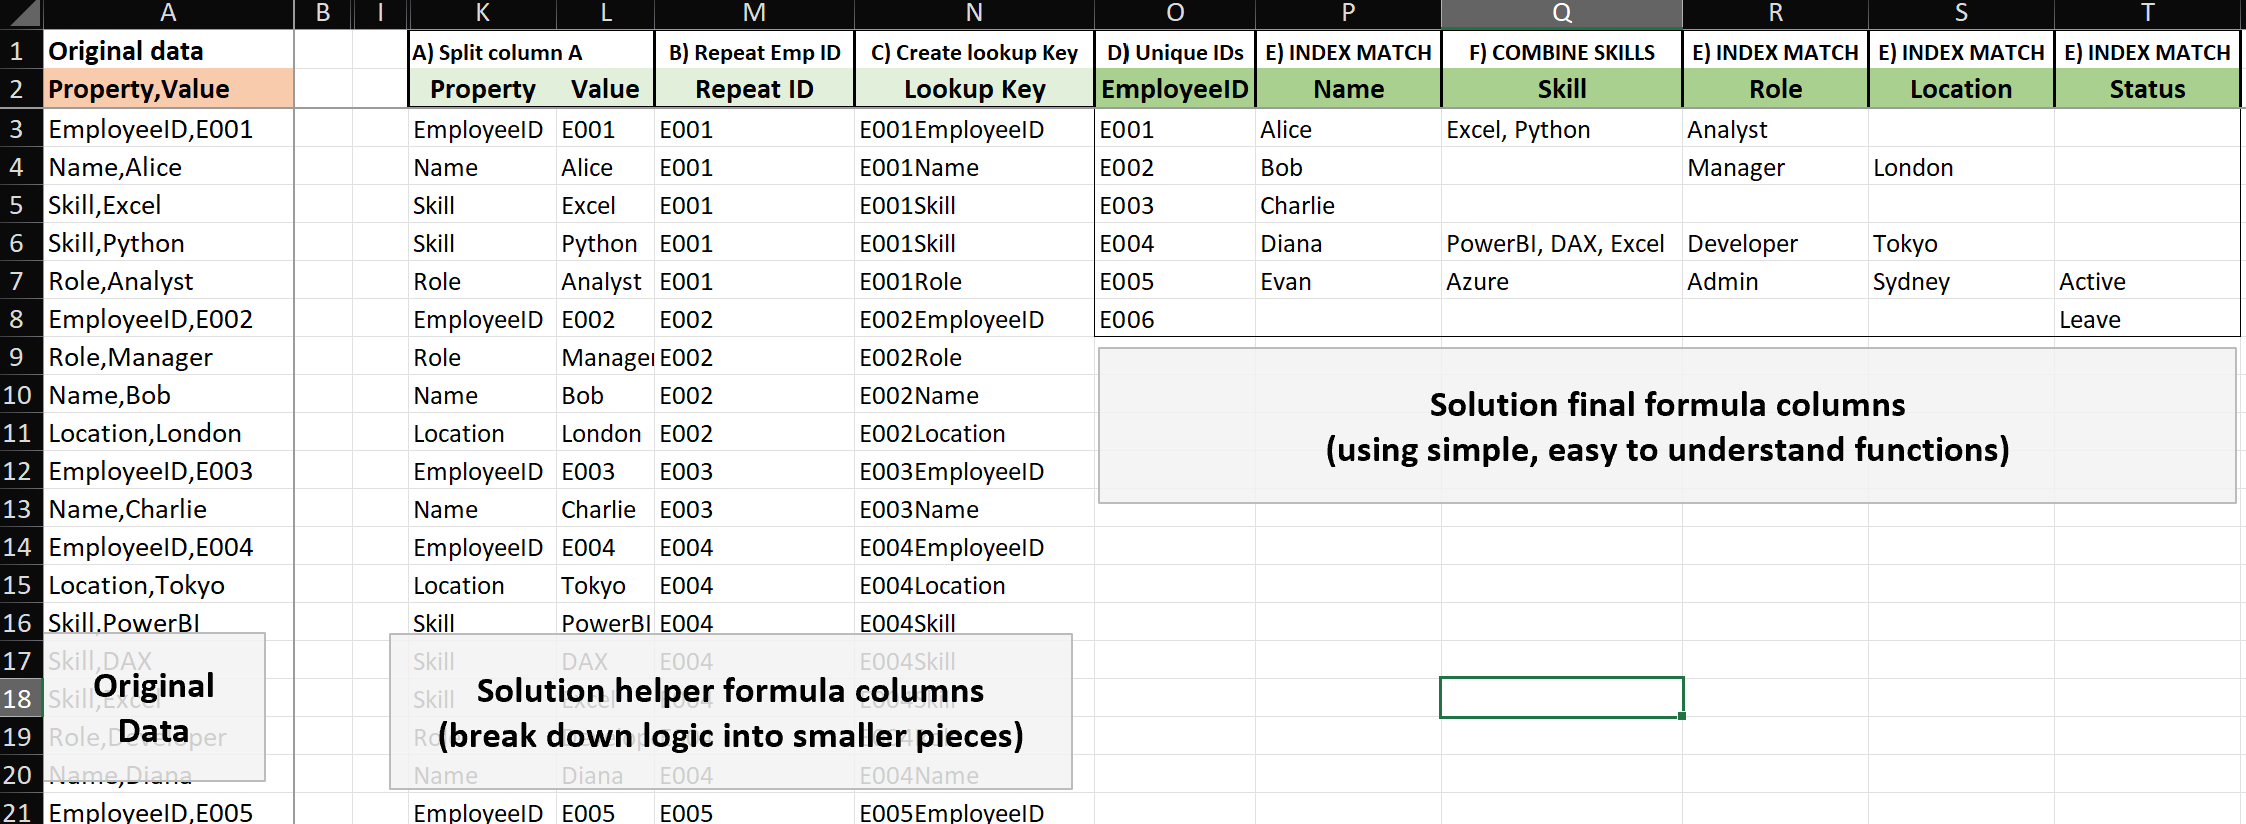
- A) Split column A =TEXTBEFORE(A3,”,”) extracts text before the comma, =TEXTAFTER(A3,”,”) extracts text after the comma
- B) Repeat Emp ID =IF(ISNUMBER(RIGHT(L3,1)+0),L3,M2) repeats EmpID down column M so we know where each group starts and ends
- C) Create lookup Key =M3&K3 I could have included this key inside the final formulas but it helps to see the key in column N
- D) Unique IDs =UNIQUE(M3:M28) creates unique list of range M3:M28 values. It’s a dynamic array function but I think it’s easy to understand. Do you agree?
- E) INDEX MATCH =IFERROR(INDEX($L$3:$L$28,XMATCH($O3&P$2,$N$3:$N$28)),””) columns P, R, S, and T all use this formula to retrieve a single value
- F) COMBINE SKILLS =TEXTJOIN(“, “,,FILTER($L$3:$L$28,$N$3:$N$28=$O3&Q$2,””)) a difficult formula to understand but it’s short. I could solve it without functions TEXTJOIN and FILTER, but it would need many steps and be confusing to explain
Yes, Step F COMBINE SKILLS formula might take time to explain but I think a level 3 Excel user could understand it.
=FILTER($L$3:$L$28,$N$3:$N$28=$O3&Q$2,"")Start with the inner part of the formula above. The answers come from column L. Column N is filtered based on a key that combines column O EmployeeID with cell Q2 text “Skill”.
TEXTJOIN is wrapped around FILTER function to put all the skills together. Cell Q3 formula is dragged down the column.
=TEXTJOIN(", ",,FILTER($L$3:$L$28,$N$3:$N$28=$O3&Q$2,""))Obviously, it would be much easier to explain all my formulas in person. I’d be able to break down each formula and also answer questions.
How many times have we heard the feedback “You’ve lost me!”. We aren’t always expected to explain the solution but when we are, it’s best to create a solution that is easier to follow/explain is smaller logical steps.
Financial Modeling World Cup
Hierarchy of Excel Users
We could debate the number of levels there should be and exactly what criteria should belong in each one for hours, but I like their hierarchy. The vast majority of Excel users are level 3 or below. The hierarchy would be much wider at the bottom and narrower towards the top but it’s not intended to be to scale.
Level 6, The Excel Esport Athlete, is an incredibly elite level of Excel and they can solve challenges incredibly fast! At the top of level 6 are only a few individuals like Diarmuid Early.
Who are they?
Learn more about them on their LinkedIn profile and their website. They have done an incredible job of turning Microsoft Excel competitions into exciting and popular events!
They organize the following events:
- Financial Modeling World Cup
- Excel Esports battles
- Microsoft Excel World Championship
- Microsoft Excel Collegiate Challenge
www.ablebits.com
I have visited ablebits website many times over the years. I like their clearly written Excel posts. They explain and demonstrate concepts very well. They have non Excel material, but my visits are all Excel 🙂
About Me

I just finished a contract. Hire me 🙂 !
I’ve worked with data for a long time and I still enjoy it! I have experience in Power BI and SQL but my strongest and favorite skill is still Microsoft Excel. I worked on an Excel hotline for 15 years and loved it 🙂
The popularity of Excel competitions has really grown over the years. I’m going to look into my local chapter here in Canada.